This guide shows how to build an automated system for processing customer conversations from Gong, surfacing valuable product insights, and enriching your product feedback database in ProductBoard. The system uses three interconnected Zapier workflows to handle the entire feedback pipeline, from initial call recording to final product insight documentation.
At Wholesail, we’ve implemented this system to automatically process every customer conversation and route high-value insights to the right places. Here’s the technical implementation, key learnings, and steps to build your own version.
The goal of this effort is to make collecting & parsing continuous feedback at scale quicker for a product team. It’s not hard to have more customer conversations across an organization than a product team can possibly listen to. It doesn’t replace doing deep research when you’re digging into a product area.
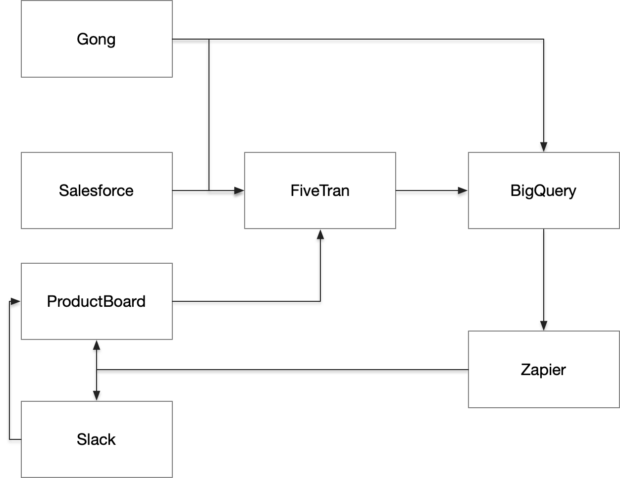
Our architecture
The Three-Zap Framework
After several iterations, I landed on a three-zap automation framework that handles the feedback pipeline. Each zap serves a specific purpose in transforming raw conversations into actionable insights.
Zap 1: Automated Call Analysis
When a new Gong call is recorded, this zap springs into action. This happens for every Gong call, but not all calls are ultimately sent to Product Board (this is the final human-triggered step). It has three main phases.
Phase 1: Pull the transcript using our BigQuery query. This relies on you already having pulled transcripts from Gong into BigQuery.
You can do this easily with the Fivetran connector, but there’s an issue: The Fivetran connector refreshes Gong data every month because it doesn’t know when data in Gong has been modified. For most Gong data, this isn’t an issue, however transcripts and some related tables specifically are quite large and refreshing all transcripts can get very expensive; I recommend you build a custom connector to pull transcripts one time, or connect directly to the Gong API using custom web hooks in Zapier for transcripts.
You want to extract your transcript with a few modifications: You want it to become one string, you want to add in speaker names, and you want to add in their role so that the LLM can focus on feedback from external parties (otherwise you get a lot of “feedback” that is your sales or account management team doing discovery). You also want to make sure that the transcript is sorted properly.
Here’s the SQL I use to get the transcript into a good format for Zapier:
WITH ordered_sentences AS (
SELECT
p.name,
p.affiliation,
t.start AS start_time,
t.sentence,
t.speaker_id,
LAG(t.speaker_id) OVER (ORDER BY t.start) AS prev_speaker,
ROW_NUMBER() OVER (ORDER BY t.start) AS rn
FROM ingestion.gong_transcripts_via_api t
JOIN ingestion.gong_call_participants p ON t.speaker_id = p.speaker_id
WHERE t.call_id = "[GONG CALL ID]"
),
grouped_sentences AS (
SELECT
name,
affiliation,
sentence,
start_time,
speaker_id,
SUM(CASE WHEN speaker_id = prev_speaker THEN 0 ELSE 1 END) OVER (ORDER BY rn) AS speech_group
FROM ordered_sentences
)
SELECT
CONCAT(name, " (", affiliation, "): ", STRING_AGG(sentence, ' ')) AS combined_sentences
FROM grouped_sentences
GROUP BY
name,
affiliation,
speech_group
ORDER BY
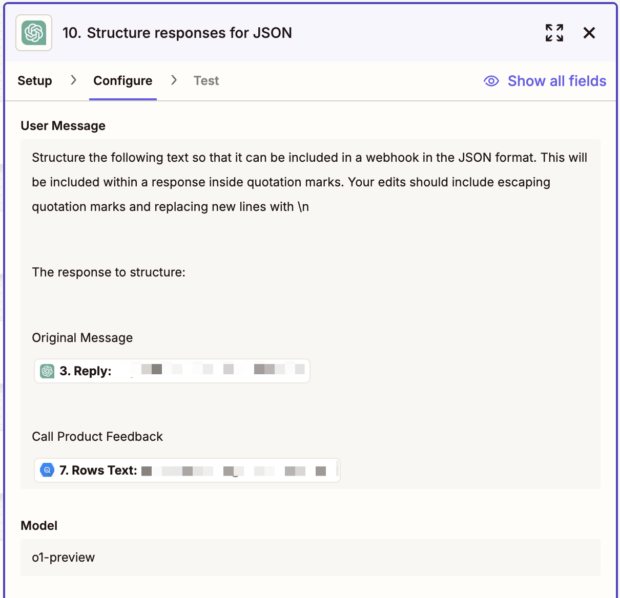
MIN(CAST(start_time AS INT)) ASC;Once I have the raw transcript, I send it to GPT-4O to clean it up. This helps make the transcript more legible because sometimes raw transcripts from Gong can be messy. This step may no longer be necessary with newer models.
Phase 2: Analyze the transcript
Once I’ve got a transcript in hand, I start my product analysis. This is a multi step process, because I’ve found sequencing the work produces better outcomes – however this might not be necessary with the newer o1 models.
First, create a feedback quality score; this step helps the model think critically, because I’ve found that if I just asked for the feedback immediately it would always find something even in calls there did not have quality feedback. We also do something similar for sales rep / account manager performance. For all the following work, I use o1-Preview.
Provide a rating on the quality of the product feedback for us. Great product feedback has 3 characteristics:
Specificity: The feedback is detailed and precise, providing clear examples or descriptions of the issue or feature being discussed. This helps the product manager understand the exact nature of the feedback and how it relates to the product.
Actionable Insights: The feedback includes suggestions or ideas for improvement that are feasible and relevant. It should offer potential solutions or highlight specific areas for enhancement, making it easier for the product manager to take concrete steps based on the feedback.
User Perspective: The feedback reflects the actual experiences and needs of users. It should explain how the product impacts the user’s workflow, satisfaction, or pain points, ensuring that the product manager can align improvements with user expectations and requirements.
5 means the feedback had all of these characteristics
4 means the feedback had 2 of these characteristics
3 means the feedback had 1 of these characteristics
2 means the feedback had none of these characteristics
1 means there was no feedbackReply with a single number, 1-5. Do not include any other text. If there is no summary, respond with a score of 0
Next, pull the ProductBoard feature list; this helps me tell the model what features to look for, and helps the model understand what kind of features might matter to my company.
I use the Fivetran connector to pull Productboard data into BigQuery for this purpose; you probably could also directly call their API for the same purpose.
SELECT
 STRING_AGG(
 CONCAT('{', CAST(f.id AS STRING), ',', f.name, '}'),
 ','
 ORDER BY note_count DESC
 ) AS features_list
FROM productboard.feature f
JOIN (
 SELECT
 nf.id,
 COUNT(DISTINCT note_id) AS note_count
 FROM productboard.note_feature nf
 JOIN productboard.note n
 ON nf.note_id = n.id
 WHERE DATE(created_at) >= DATE_SUB(CURRENT_DATE(), INTERVAL 2 YEAR)
 GROUP BY 1
) nf
 ON f.id = nf.id
WHERE NOT archived
 AND JSON_EXTRACT_SCALAR(status, '$.name') NOT IN ('Complete')NOTE - This should be your list of "complete" statuses
 AND note_count >= 1;
I only include features that had notes linked in the past 2 years to filter out some of the noise. I probably could limit this further. I’ve also considered bringing in feature descriptions so that the model can have a richer understanding of what the feature means, but we’d first need to go through a big project to add descriptions to Productboard (or have the description written by an LLM based on linked notes – a future project).
Phase 3: Bring it together & get specific feedback
Then combine the rating + the list of possible features and request the model to assess.
Please review the following sales call transcripts and identify feedback that is both uncommon and critical for improving Wholesail’s product.
We define ‘uncommon but critical’ feedback as follows:
Specific gaps in our product or features that competitors don’t address as well.
Unexpected insights about our features or creative uses of the platform.
New functionality or enhancements that could greatly improve the user experience for vendors or buyers.
Edge case needs from vendors that could unlock broader adoption.
Deep frustrations with something we could reasonably fix, even if it’s not widely discussed.Only highlight feedback that is specific, actionable, and from the user’s perspective (clear examples, ideas for improvement, or insights that reflect real user needs).
Here are the features that we have identified in general; note if any are relevant: [[Productboard feature list]]
Please avoid highlighting: Common issues like [XXX] or [YYY] unless they provide specific, actionable details related to our offering.
If feedback is generic or not valuable, simply state ‘There wasn’t much.’ Avoid filler or summarizing common issues.
====
Cleaned Call Transcript:
[[The Gong Transcript generated earlier]]
The results of all these queries are stored in Big Query so that we can use them in different ways throughout our workflows.
Zap 2: Slack Annoucements
Our second zap monitors the BigQuery table where the results of our analysis are stored. When a new call is processed, it reviews it to see if we think it is relevant to different audiences. We focus on:
- Calls with a high feedback quality rating
- Calls with large prospects or partners, regardless of feedback quality rating
The notes are summarized and shared to Slack with key information about the account (like vertical, account size, products) to share context.
We use the Productboard Slack integration, so that anyone can choose to send a Gong call summary with it’s related features to Productboard.
Zap 3: ProductBoard Enrichment
When a Gong call is shared to ProductBoard, this zap enriches it with our analysis. This makes it much faster for the product team to triage feedback that has been shared.
- Query BigQuery for stored analysis
- Get the ProductBoard company ID. We use the Productboard Salesforce connector, which pulls in metadata about our customers and prospects; this allows us to do things like “see what features matter most to bakeries” – but this means we need to tie all our notes to customers. With Gong this is straightforward because Gong <> Productboard <> Salesforce are all tied to the same customer list with the same customer names.
We can do a Zapier GET custom webhook to Productboard to search for the company name. Zapier does have a Productboard API call feature, but I’ve not been able to get it to work successfully.
GET https://api.productboard.com/companies?pageLimit=1&term=[[COMPANY NAME]]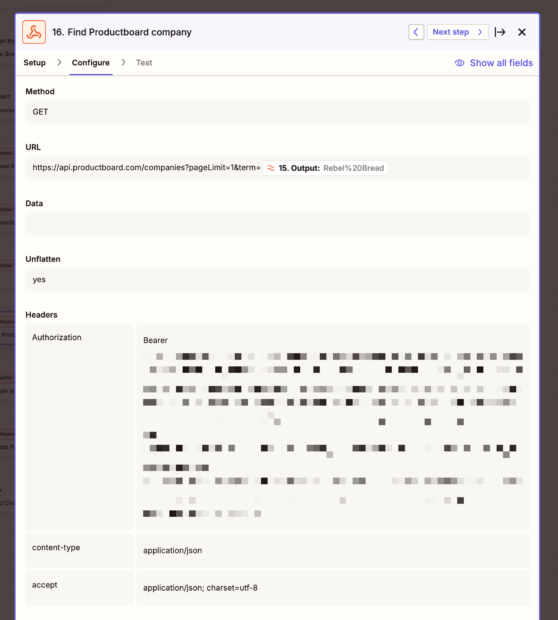
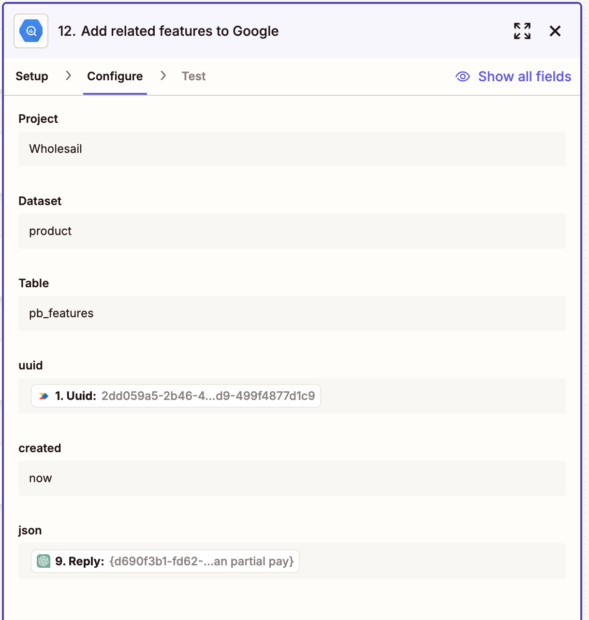
- Update the ProductBoard note: In this case I update the content to have the enriched feedback + update the company ID. Note that the JSON here needs to be encoded properly; you might need additional steps in your zap to remove line breaks and escape quotes, for example. I’ve done this both by using Zapier’s text formatter (which requires multiple steps) and by using Open AI.
PATCH https://api.productboard.com/notes/[PB UUID]
{
 "data": {
 "content": "[[ENRICHED FEEDBACK]]",
 "display_url": "https://us-9221.app.gong.io/call?id=[[GONG ID]]",
 "company": {
 "id": "[[COMPANY ID]]"
 }
 }
}
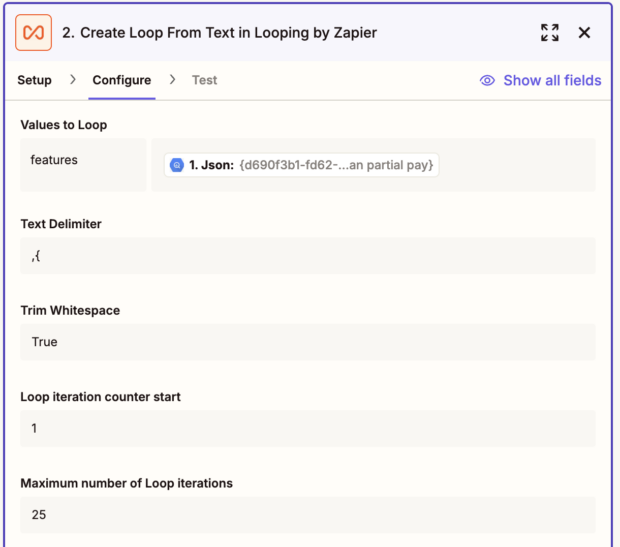
4. Finally, I tag the note with the features I identified before. This requires using Zapier looping; one limitation is that you can only one one loop per zap, so I’ve made this a standalone zap triggered by new rows getting stored in a BigQuery table.
This is how my loop is configured. I then need to extract the feature ID from the JSON which I do using a regex with the Zapier formatter.
Once I have the ID, I can connect to features:
POST https://api.productboard.com/notes/[NOTE UUID]/links/[FEATURE UUID]As a final step, I tag all notes I update in this fashion with a robot tag, so that I can come back for human review an evaluation later.